Business Intelligence & Analytics

Problem Statement

BIA diagram
  • Most organizations have disconnected spreadsheets, desktop databases, reporting tools, analytic and query tools, data warehouses and NO business intelligence and reporting strategy
  • Technology and operations teams get tied down with administrative overhead due to disconnected and inconsistent data and information
  • Many federal agencies struggle to create measure and manage performance metrics (KPI’s)
  • Most organizations have very high time to insight because they do not invest on BI competencies

How can we help?

BIA diagram2

Power BI – Dashboard and Visualization services
Aggregate, Analyze, Visualize and share data and insights

Qlikview– Dashboard and Visualization services
Augment and enhance human intuition with AI powered insights, and helps people move from passive to active analytics for real-time collaboration and action.

BI Self-service Portal
Build self-service BI solution enables business analysts, executives and other users to run queries themselves and create their own data visualizations, dashboards and reports.

Business Analytics services
Help organizations extract maximum business value from data by analytics delivery through predictive and prescriptive analytics, AI and Natural language processing

Logical Architecture

These components should run in sync with the processes of the intelligent organization:
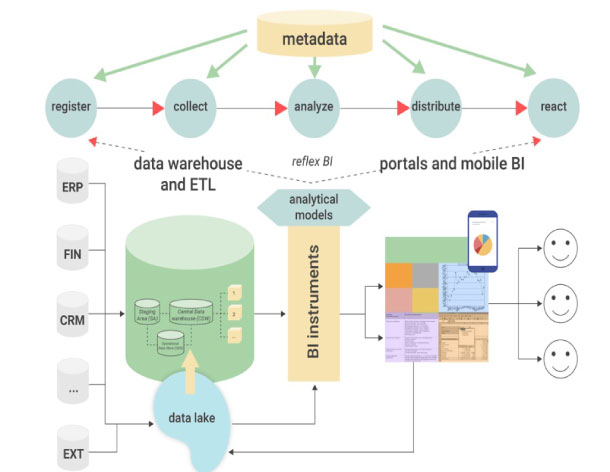
  • Registering data in internal systems, databases, or with sensors
  • Collecting data, cleansing it, combining it, and aggregating it in a data warehouse or a data lake
  • Analyze using Business Intelligence tools and analytical models
  • Distribution of insights, dashboards, reports, and analyses using portals and mobile BI
  • Reaction by the organization’s directors: the decision-making process
BIA diagram3